Endpoint Insights
Starting with Power BI Desktop and SCCM
Topics: Endpoint Insights
Starting with Power BI Desktop and SCCM
In this blog post I will show you how to connect Power BI Desktop to your System Center Configuration Manager (SCCM) SQL Server database. During the connection process I will then show you how I added a query and created a basic table, so you can do the same!
Before starting, though, make sure to download and install Power BI Desktop. If you haven’t yet, then I would recommend that you first see my blog post, How to Install Power BI Desktop, before continuing. Also make sure to have the SQL Server query ready to go that you plan to use within your new Power BI dashboard!
After Power BI Desktop is first installed and launched, you will be asked to create an account. If you haven’t filled out the account details yet, then make sure to do so and then click on Done. If you already have an account, click on the Already have a Power BI account? Sign in link.
Enter in your account name and click Sign in.
Enter your password.
Connecting Power BI Desktop and SCCM
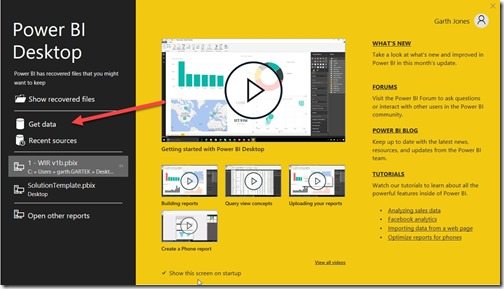
Once you are presented with the Power BI Desktop pop-up, as shown above, click on Get data in order to connect to your SCCM SQL Server database.
Select SQL Server database and click Connect.
On the SQL Server database window, enter in your SQL Server’s name and database’s name. Then click on the Advanced options link (purple arrow).
IMPORTANT! If you plan on having two or more queries from the same database, make sure that you enter your server’s and database’s names using the same case (either upper or lower). Otherwise Power BI might consider them as two different data sources. This will definitely cause you headaches later on! I always try to remember to use lower case for both the server and database names.
Insert the SQL Server query into the SQL statement window and click OK.
A preview of the data is shown, so click Load to continue.
After the data loads, you are presented with the Power BI Desktop canvas. Notice how the columns from the query are listed on the right-hand side of the canvas (highlighted in purple)?
Removing the Sum Function from the ResourceID
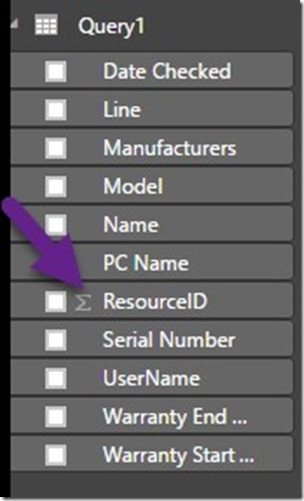
The first thing that I’m going to do is turn off the Sum function on the ResourceID. Power BI automatically added this function when the query was imported.
Select the ResourceID and click on the Modeling tab.
Select the Don’t summarize option (purple arrow) under Home Table.
Creating a Power BI Desktop Table
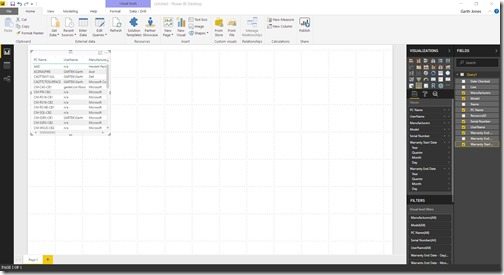
On the right-hand side, select the items you want within the table. They will be added in the same order as you select them. In my case I selected, PC Name, UserName, Manufacturers, Model, SerialNumber, Warranty Start Date, and Warranty End Date. Notice that the table will need to be expanded in order to see all of the column details.
Once I expanded the table, Power BI automatically broke-down the Warranty Start Date and Warranty End Date information into Year, Quarter, Month and Day columns.
In case you don’t want to see one of the columns, I’ll show you how I turned off the “Quarter” column. On the right-hand side of the Power BI Desktop canvas, under the Values section, I clicked on the, “x,” next to Quarter for the Warranty Start Date and Warranty End Date.
In real time, as I removed the Quarter columns, they automatically disappeared from the table!
Congratulations! You completed your first Power BI dashboard using SCCM SQL Server data as your data source.
You can keep repeating this process by adding more tables, charts, maps, etc., to the Power BI Desktop canvas until you are happy with your dashboard. Don’t forget to save it! In my upcoming blog posts, I will focus on how to add charts and apply color to Power BI dashboards.
